Business Intelligence
MSP Technician Utilization Rate: What's a Good Benchmark, and How Do You Actually Track It?
November 14, 2022


Ask ten MSP owners what their technician utilization rate is, and most will give you a rough guess, not a real number. Ask what number they're actually targeting, and the guessing gets worse. That's not a knowledge problem. It's a visibility problem. Utilization is one of the most important metrics in MSP operations, and one of the least reliably tracked, because most MSPs still depend on technicians logging every minute of their day by hand.
The result is a number that's either wrong or three weeks stale by the time anyone looks at it. And without a clear benchmark to compare against, even an accurate number doesn't tell you much. Here's what a healthy MSP technician utilization rate actually looks like, why chasing 100 percent is the wrong goal, and how to track it without relying on perfect time entries.
What Is Technician Utilization Rate, and Why Does It Matter?
Technician utilization rate is the percentage of a technician's available working hours that are billable. The formula is simple: billable hours divided by available hours. The tracking is the hard part.
Utilization matters because it's the clearest signal you have of whether your team's capacity is being used well. Run it too low, and you're paying full salaries for partial output, which quietly erodes margin on every contract those technicians touch. Run it too high, and you're looking at burnout, turnover, and the kind of quality slips that show up in client complaints months after the root cause.
What's a Good MSP Utilization Rate Benchmark?
Most MSPs should be targeting a technician utilization rate between 65 and 75 percent. That range accounts for the reality of the job: time off, training, internal meetings, and the unavoidable non-billable work that keeps an MSP running. A team consistently below 65 percent usually has a capacity or dispatch problem, not a demand problem. Work exists, it's just not reaching technicians efficiently. A team consistently above 85 percent is a warning sign, not a success metric. That level is rarely sustainable, and it tends to show up as increased sick time, slower resolution quality, and attrition within two to three quarters.
The right target also varies by role. Senior engineers handling complex, project-based work often run lower utilization by design, since strategic and pre-sales time doesn't show up as billable hours. Help desk technicians handling high-volume ticket work should sit closer to the top of the range. Benchmarking against your own peer group, not just an industry-wide average, gives you a more useful comparison than a single number ever will. (If you want a gut check on where your numbers actually stand against other operators, MSP peer groups are one of the fastest ways to get an honest answer.)
Why Manual Time Tracking Gets This Number Wrong
The traditional approach to utilization tracking asks technicians to log every minute of their day accurately, consistently, and honestly. In practice, that almost never happens. Technicians round up or down, batch their time entries at the end of the day from memory, or skip logging short tasks entirely because it feels like more admin than the task was worth.
The consequence isn't just an inaccurate number. It's a number leadership can't trust, which means it stops being used for decisions at all. Once a metric gets a reputation for being unreliable, it gets ignored, and the visibility problem it was supposed to solve just moves somewhere else.
How to Track Utilization Without Relying on Perfect Time Entries
The fix isn't asking technicians to be more diligent. It's pulling the data from systems that already know what happened, regardless of whether anyone remembered to log it manually.
Pull Data Directly from Your PSA and RMM
Automated utilization dashboards connect directly to your PSA and RMM, whether that's ConnectWise Manage, Autotask, HaloPSA, or another platform, and reconstruct actual time usage from ticket activity, time entries that were logged, and system-level activity data. This gives you an accurate picture broken down by technician, team, board, and date range, without depending on every technician remembering to log every minute.
MSPbots' Utilization Analysis Dashboard, for example, analyzes trends across the last 16 weeks alongside more immediate rolling windows, so managers can spot patterns (a technician trending downward for three straight weeks, a team consistently over capacity on Mondays) instead of reacting to a single bad month after the fact.
Look at Trends, Not Snapshots
A single utilization number for one week tells you almost nothing. The same number trending downward for a month tells you something is changing, whether that's a staffing gap, a shift in ticket mix, or a technician quietly disengaging. Trend visibility is what turns utilization from a report you glance at into a metric you actually manage by.
What Should You Do Once You Know Your Number?
If Utilization Is Running Low
Low utilization is usually a routing problem before it's a demand problem. Check whether tickets are getting cherry-picked, whether dispatch is balancing workload evenly across the team, and whether ticket triage is routing work to the right technician the first time instead of bouncing between boards. Fixing the flow of work often recovers more utilization than adding new client work does.
If Utilization Is Running High
High utilization needs a different response: relief, not praise. Look at whether the workload is sustainable across a full quarter, not just a good month, and whether it's time to redistribute tickets, adjust staffing, or revisit pricing on the accounts driving the heaviest load. Automated MSP dashboards that track this trend in real time make it possible to catch the problem while it's still a scheduling fix, not a resignation letter.
Connect Utilization to Profitability
Utilization and contract profitability are two sides of the same coin. A contract that looks profitable on paper can quietly turn unprofitable if the hours it demands keep creeping up. If you're seeing utilization climb on a specific account without a corresponding price change, that's an early warning sign worth investigating before it compounds into a margin problem you don't notice until the next QBR.
MSP Technician Utilization: Quick Reference
MetricGuidanceHealthy utilization range65 to 75%Warning sign: too lowBelow 65%, usually a routing or dispatch issueWarning sign: too highAbove 85%, a burnout and turnover riskTrend window to reviewLast 16 weeks, plus a shorter rolling windowFormulaBillable hours divided by available hours
Stop Guessing, Start Tracking
Technician utilization shouldn't be a number you estimate once a quarter based on gut feel. It should be something you can see in real time, broken down by technician and team, without chasing anyone down about their time entries.
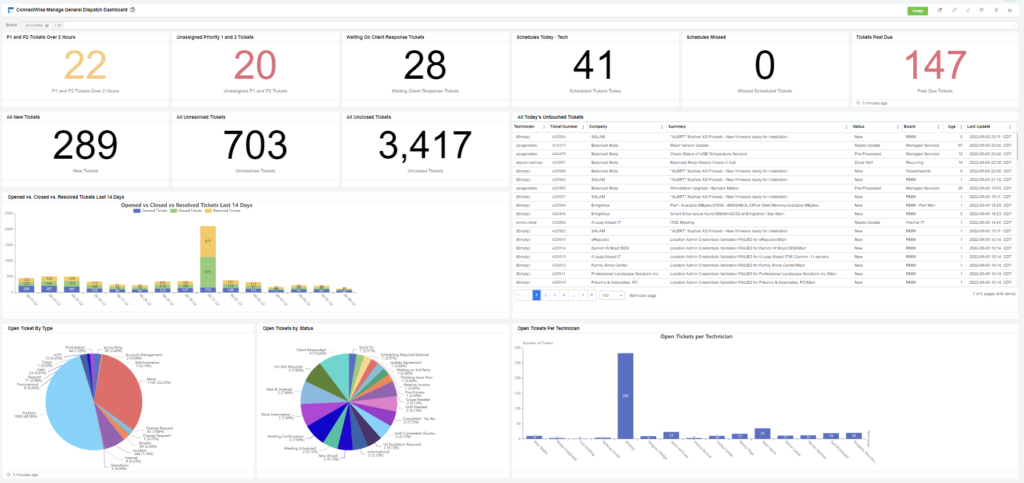
Service and Project Tickets
This dashboard gives you a fast snapshot of the technician efficiency for the current week. It displays the service and project ticket counts.

Service Tickets Review
You can see how the last 30 days have gone by looking at the important ticket count, percentage of new/closed tickets, and Average time to response or resolution on this dashboard. Resolution Time, Sub-type, Ticket Status Summary, Ticket Count by Age Group, and Ticket Status by Severity. With this, you can shorten the time it takes to resolve tickets.
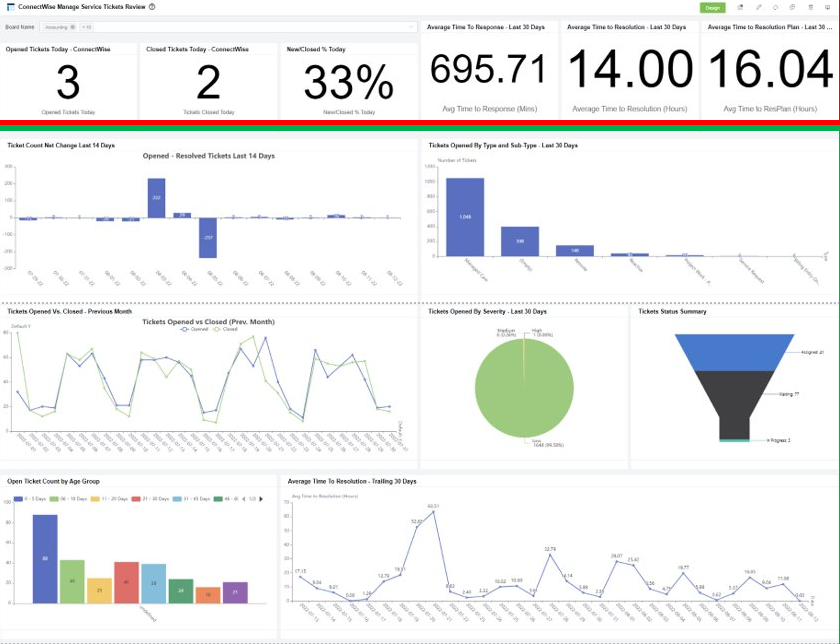
Technician Dashboard
The Manage Technician dashboard gives information on today’s unanswered tickets, the charts for unresolved tickets by status, the number of actual hours for time entries entered by technicians in the previous and current week, and the count of keys that need to be verified by technicians.

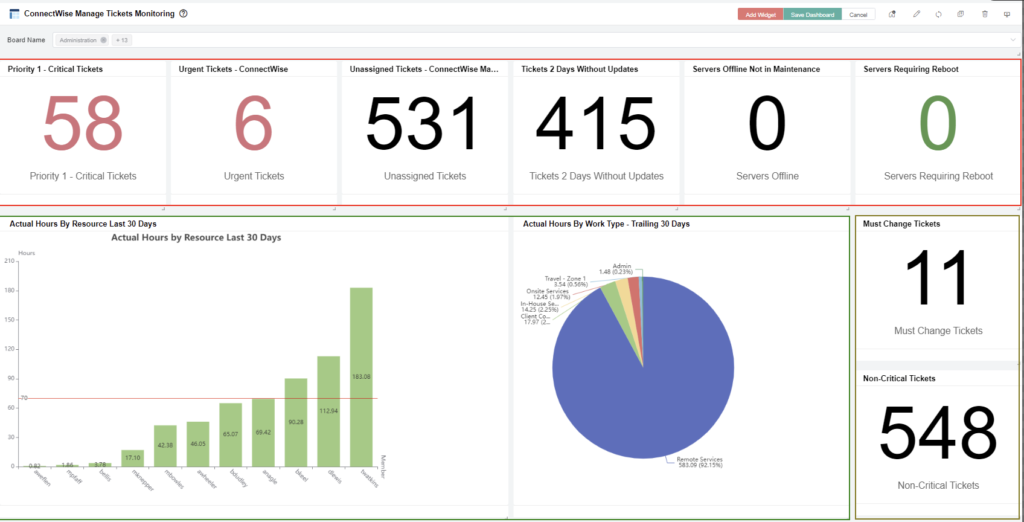
Tickets Monitoring Dashboard
This dashboard shows which services need to reboot or are currently not running. Additionally, it displays the actual hours by Resource each month to assign tickets to technicians and track tickets across all boards.
Ticket Summary
Ticket Summary gives you the number of tickets and the typical time spent working on each ticket. This reduces the likelihood of missed open tickets or an inaccurate ticket count.

Month-to-Date Dashboard – Current Month
Utilization Rate, Hours Worked, and Ticket Opened report views are available in this dashboard. For the current month, it displays the utilization rate, and the number of tickets worked on for each tech.

With this dashboard template, your MSP’s problems are resolved immediately. This collection of sample reports displays metrics and performance scores for tasks, services, and support issues for instant action. We value our teams and technicians, and we must work with them to maximize their efficiency. With these dashboards, you can monitor, respond to issues, and protect your staff and clients.
With MSPbots, you can monitor utilization trends automatically across your PSA and RMM, spot capacity issues before they turn into burnout or missed SLAs, and connect utilization data directly to the profitability numbers that actually drive decisions. Book a demo to see what your real utilization numbers look like, not the estimate you've been working off of.
November 14, 2022