Business Intelligence
Here are Business Intelligence Dashboards to Help you Manage Projects with Ease
October 20, 2022


If you’re an MSP company owner, chances are good that your business is going to have some major projects to handle. If you’re like most MSP companies, those projects will change and evolve over time, varying in degree and difficulty as required by your customers. Keeping track of your projects can seem like a whole separate project in itself if not properly managed.
While projects may appear simple on the surface, understanding what constitutes a project, how contracts affect project’s timelines, and how to manage them daily can be difficult, particularly for MSPs with little experience in project management. After all, projects require meticulous planning and scheduling in order to be completed on time.
To assist MSPs with this challenge, MSPbots offers BI tools that provide insights on how to approach and manage MSP projects in a way that helps your business grow while keeping your clients satisfied.
Get the Big Picture Covered and Access your Project Metrics
When it comes to the health of your business, you need to see the big picture. The big picture can be the overall data your team is providing on a particular project. It’s not your project’s individual elements, per se, but rather a summary of those elements as a whole. However, if you can’t easily digest it, especially on a daily or weekly basis, then you’ll get distracted from what matters most: making progress on your project and getting solid results.
MSPbots’ Project Metrics Suite offers invaluable insights for your projects, so you as a stakeholder can monitor progress and provide timely support to your team. The ability to track these project metrics will give you confidence in the work being done by all of your team members so they know when they have room for improvement or whether there’s anything missing from their workflow process.

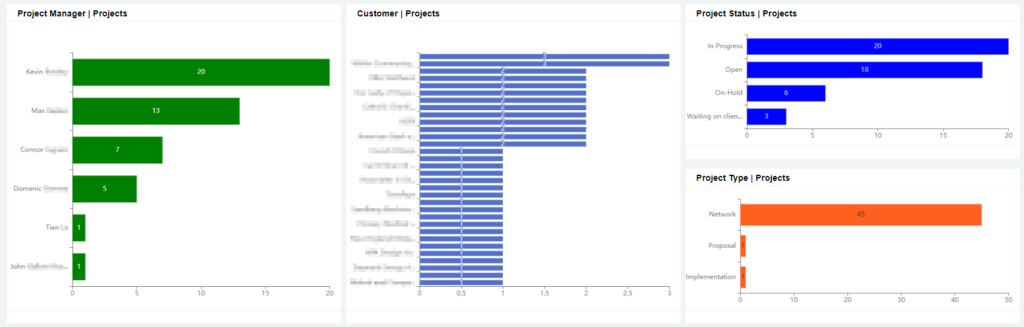
Project Summary
Displays the Cost Performance Index (CPI), the percentage (%) of projects that are on track in terms of delivery date and budget hours, and a breakdown of projects by status, customer, and manager.

Project Details
The Project Details dashboard enables users to drill down into specific projects or customers and see additional details that affect project completion, such as % Budget Remaining, Start Date, and Scheduled Date.

Project Completion
This dashboard shows a summary of project completion by dividing projects by the number of days until the scheduled completion date.

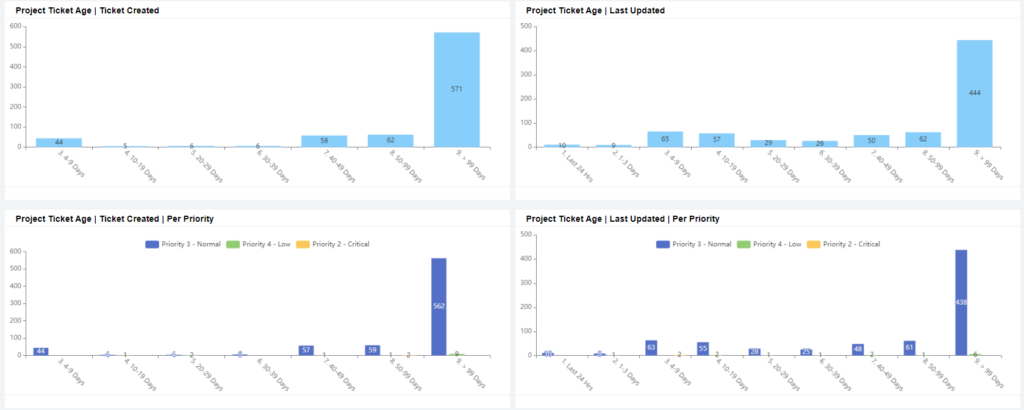
Active Project Tickets Summary
This dashboard displays the number of active project tickets organized by board, status, and date created. Further, it provides complete visibility of aging project tickets in terms of the Created Date and Last Updated Date.

Gain more time back in your day and get real data faster with the newly available project dashboards from MSPbots. You’ll be able to see trends, track progress over time, and make better decisions based on the information you’ll have access to. It’s important to not just look at data in general; it’s about how it looks when displayed in different ways and with varying levels of detail to gain meaningful results.
Defining and managing projects in a MSP business is more difficult than it appears. But with a deeper understanding and the right tools, you can manage your MSP projects successfully.
Access the Project Metrics Suite and more via MSPbots’ Marketplace. Utilize and integrate them now for your ConnectWise Manage and see how powerful BI tools can make a difference for your business.
Book a demo to explore and learn more about how Business Intelligence tools can help your MSP succeed!
October 20, 2022